Track every position. Know exactly what to close, what to roll, and what to hold.
Options Tracker is a dashboard for wheel strategy traders — CSPs, covered calls, and full cycles. Every session opens with Action Signals: a rules-based scan of your portfolio that tells you exactly what needs attention today.
Free forever on the base plan · Takes 2 minutes to import your first positions
The Problem
Running the wheel across 10+ tickers? Your spreadsheet can't keep up.
Most wheel traders track positions in Excel or Notion. That works — until you're juggling 12 open puts, 3 covered calls, two assignment cycles, and you can't tell at a glance which ones are ready to close for profit, which need to be rolled, and which are sitting on top of an earnings date.
No single view
Greeks in the broker app, P&L in a spreadsheet, earnings dates in a calendar. Three tabs, zero clarity.
Missed exits
By the time you notice a position hit 50% max profit, the window's closed. No alerts, no close signal.
Earnings blindspots
You sold a put on NVDA. Earnings are in 6 days. You didn't check. Now you're holding through a binary event.
Options Tracker solves all three — without replacing your broker.
Step 1
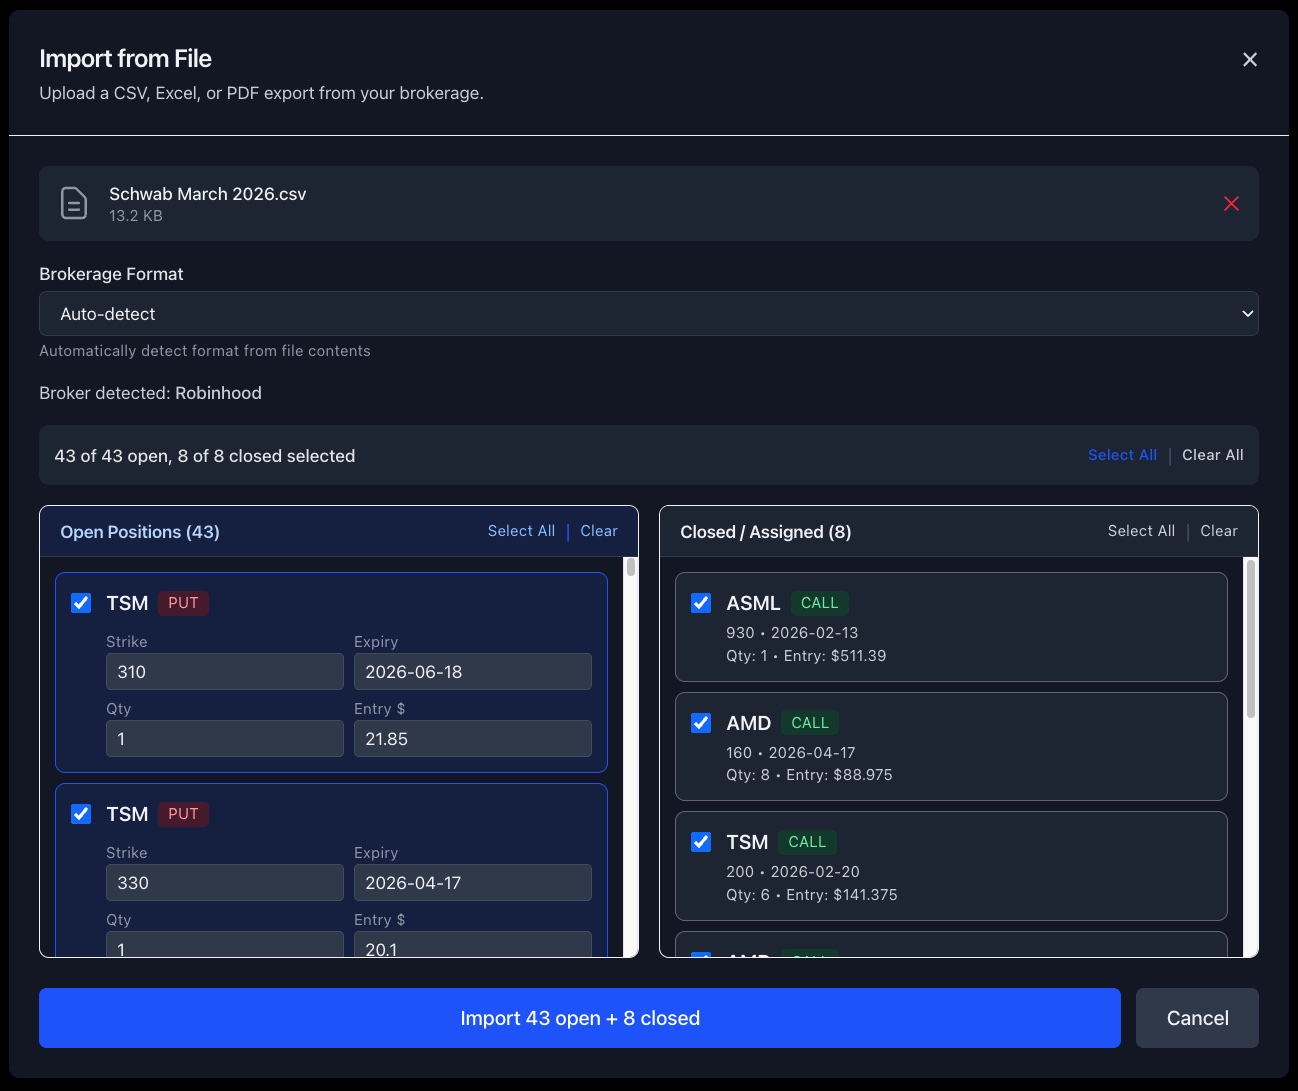
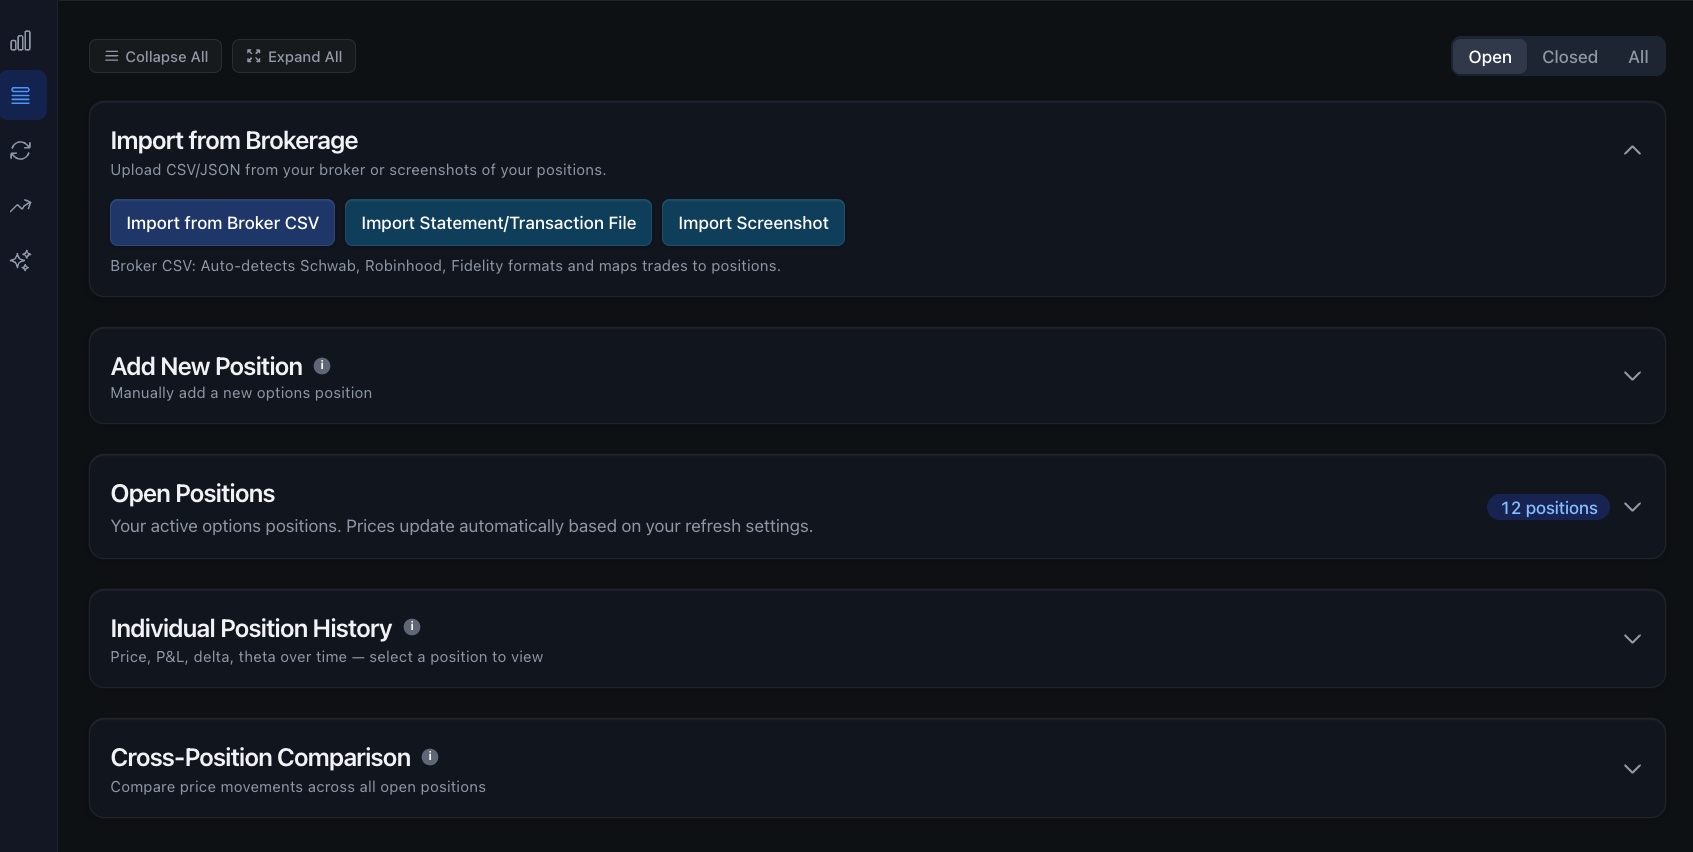
Import from your broker in 30 seconds.
Export your positions CSV from Schwab, Robinhood, or Fidelity. Options Tracker auto-detects the format and loads your strikes, expiries, premiums, and quantities — no reformatting needed.
Open Positions
10 positions · Auto refreshClick any row · Greeks · Sparkline · AI recommendation
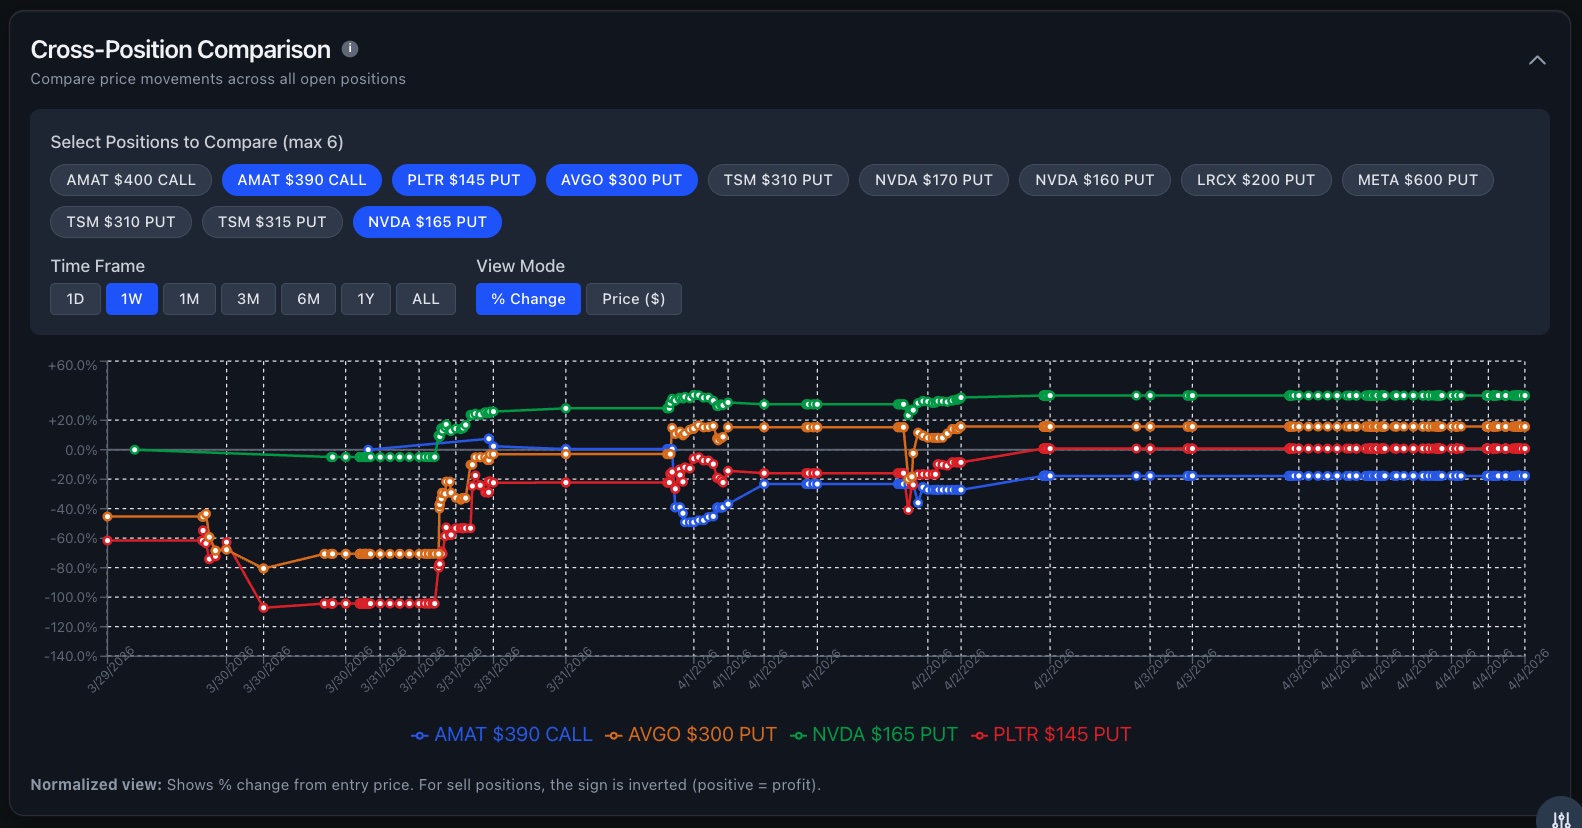
Compare positions side-by-side — % change or price ($)
Step 2
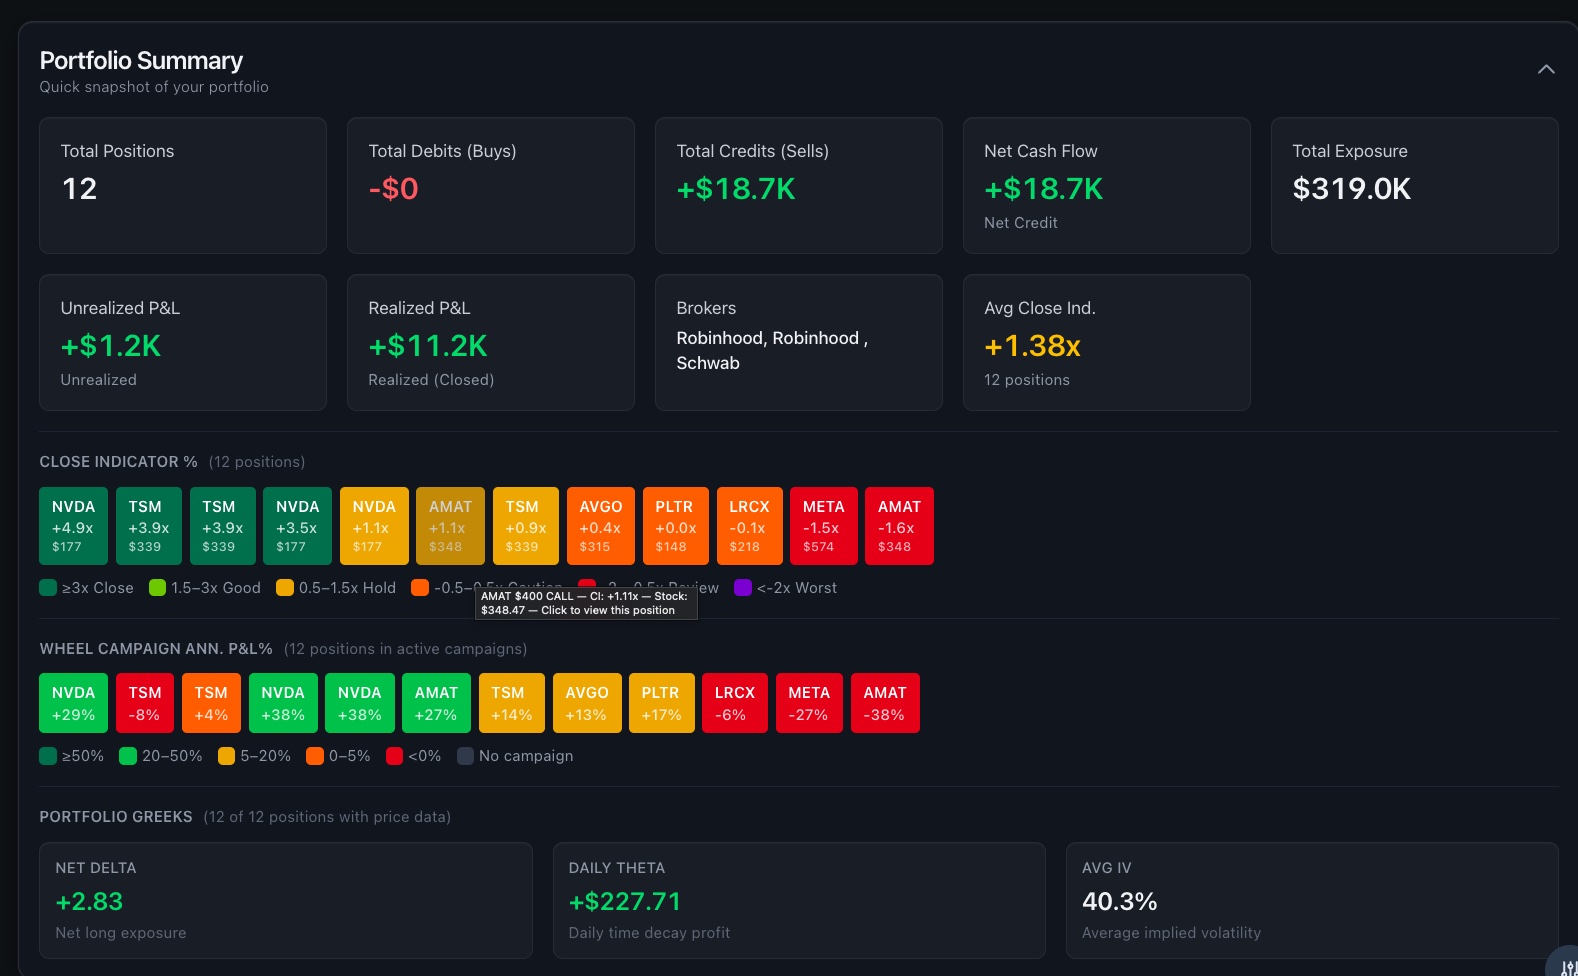
One screen. Every open position. Everything you need to decide.
The positions table shows your full wheel portfolio — live prices, Greeks, P&L, DTE countdown, and the Close Indicator (CI) — so you know at a glance what needs attention today.
Step 3
One map. Every position. Close, roll, or hold — instantly clear.
The Close Indicator (CI) measures how much premium you've captured relative to how much time has elapsed. Click any position card to jump directly to its full detail view — Greeks, P&L sparkline, cash flow, and an AI-powered recommendation.
Close for profit
CI above threshold. You've captured most of the available premium with time still remaining. Take the win.
Hold or monitor
CI in neutral zone. Position tracking normally. Check back at next DTE milestone.
Review — consider rolling
CI below threshold. Position moved against you relative to time elapsed. Rules-based and AI recommendations available.
Step 4
Every morning, know exactly what needs attention. No spreadsheet required.
The Action Signals panel scans your entire portfolio and flags positions that are ready to close for profit, approaching expiry, showing losses relative to time, or prime for rolling. One panel, zero guessing.
Action Signals
Rules-based · Updates on refresh
An AI coach that knows your exact positions — not generic advice.
Ask AI Options Coach about any of your open trades. It sees your strikes, expiries, P&L, and Greeks — and gives you specific, actionable answers.
Roll advice with exact strikes
"Roll your NVDA $175 put to the $170 strike for May 16 and collect $1.40 credit" — not a generic explanation of rolling.
Earnings risk on your positions
Knows which of your open positions have earnings before expiry. Tells you the exact risk and whether to close, roll, or hold.
50%+ profit close signals
Scans your portfolio for positions that have captured enough premium. Tells you which ones to close early and why.
Assignment risk assessment
For every ITM short put, gives assignment probability and a decision: take shares, roll down, or roll out.
AI Options Coach
5 positions in context
Two positions to roll this week:
NVDA $175 Put (18 DTE) — roll to the $170 strike for May 16, collecting ~$1.40 credit. You're down $320 but theta is on your side with this move.
AMAT $140 Put (12 DTE) — roll out 30 days to the same strike. The $0.95 credit covers your current $280 loss and gives time for recovery.
⚠️ Educational analysis only — not financial advice.
Available on Pro · 7-day free trial
Step 5
Don't sell premium into an earnings date you didn't see coming.
The earnings risk scanner checks every open position against the upcoming earnings calendar. Any exposure inside your DTE window is flagged — before you get caught.
RED
Earnings inside your DTE window. High risk. Consider closing or rolling before the report.
YELLOW
Earnings within 7 days outside DTE. Watch closely.
GREEN
No earnings overlap. Safe to sell premium.
Earnings Risk Scanner
Flags positions with earnings inside the DTE window
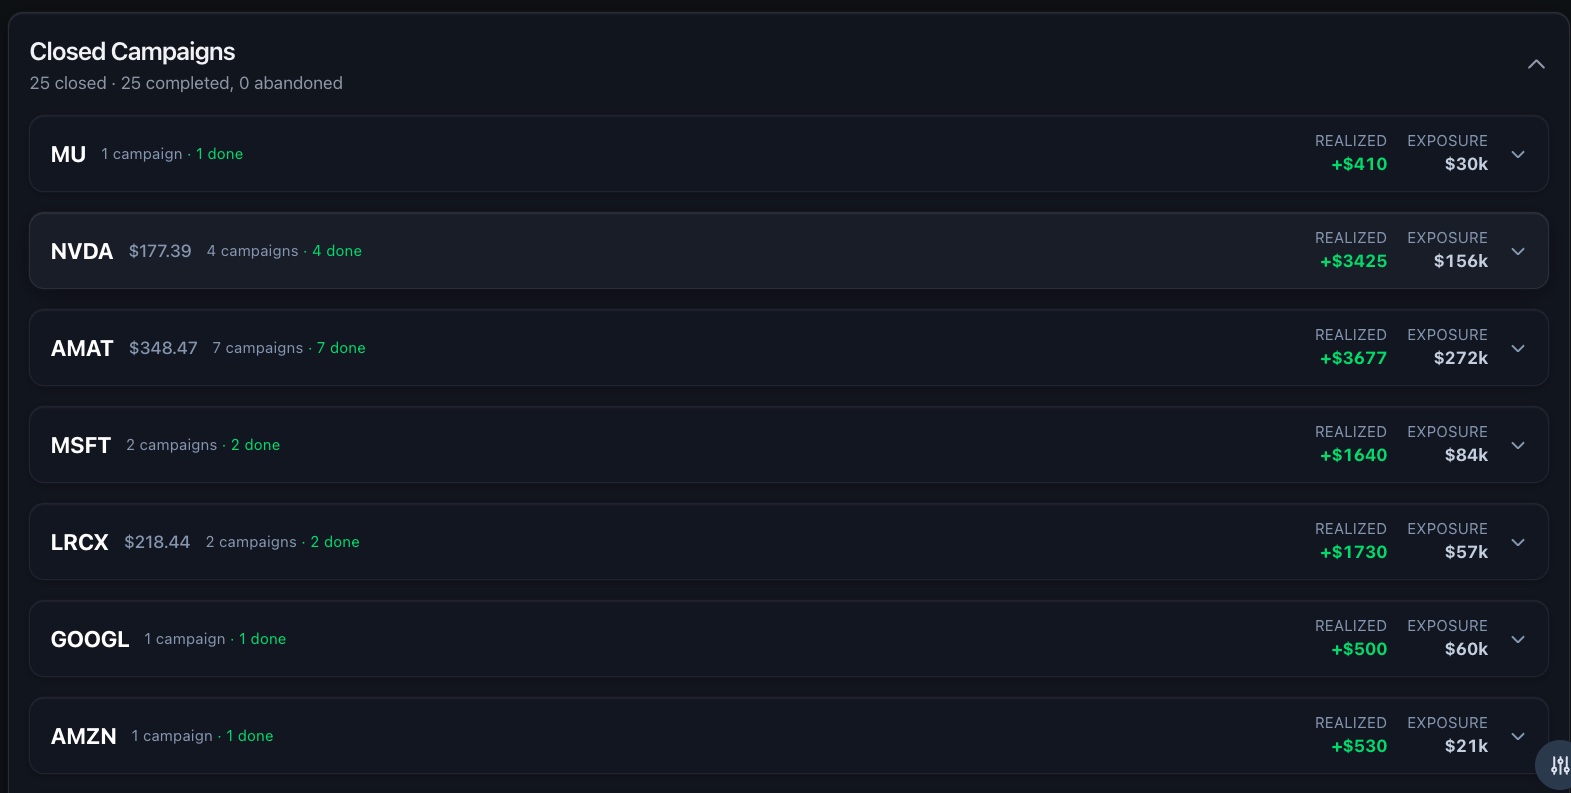
Wheel Campaigns
Auto-detected · Full cycle tracking
Step 6
From first CSP to final covered call — one cycle, one view.
Options Tracker links your trades into wheel campaigns automatically. See total premium collected, adjusted cost basis, and cycle P&L — not just trade-by-trade P&L.
- ✓Auto-detects legs from trade history
- ✓Running ACB calculation
- ✓Phase badges: CSP → Assigned → CC → Called Away
Step 7
Every closed trade, tracked. Know your real premium yield.
Your closed history shows realized P&L, win rate, premium collected by month and by ticker, and profit factor — the numbers that tell you whether your wheel is actually working.
Monthly premium income — see exactly what your wheel is generating
Your Data
Built local-first. Your positions stay on your device.
We don't sell data. We don't run ads. We make money when you upgrade to Pro because the tool is worth it.
Stored locally by default
Your positions live in your browser. Nothing is sent to any server unless you enable Pro sync.
Pro: trade from anywhere
Check DTE on your phone while executing on desktop. Pro sync keeps everything current across devices.
No broker access. Ever.
We never connect to your brokerage. CSV import only. Your login credentials stay with your broker.
More tools for serious wheel traders.
Position Sizing Calculator
Account size + risk % → max contracts, capital required, annualized yield before you place the trade.
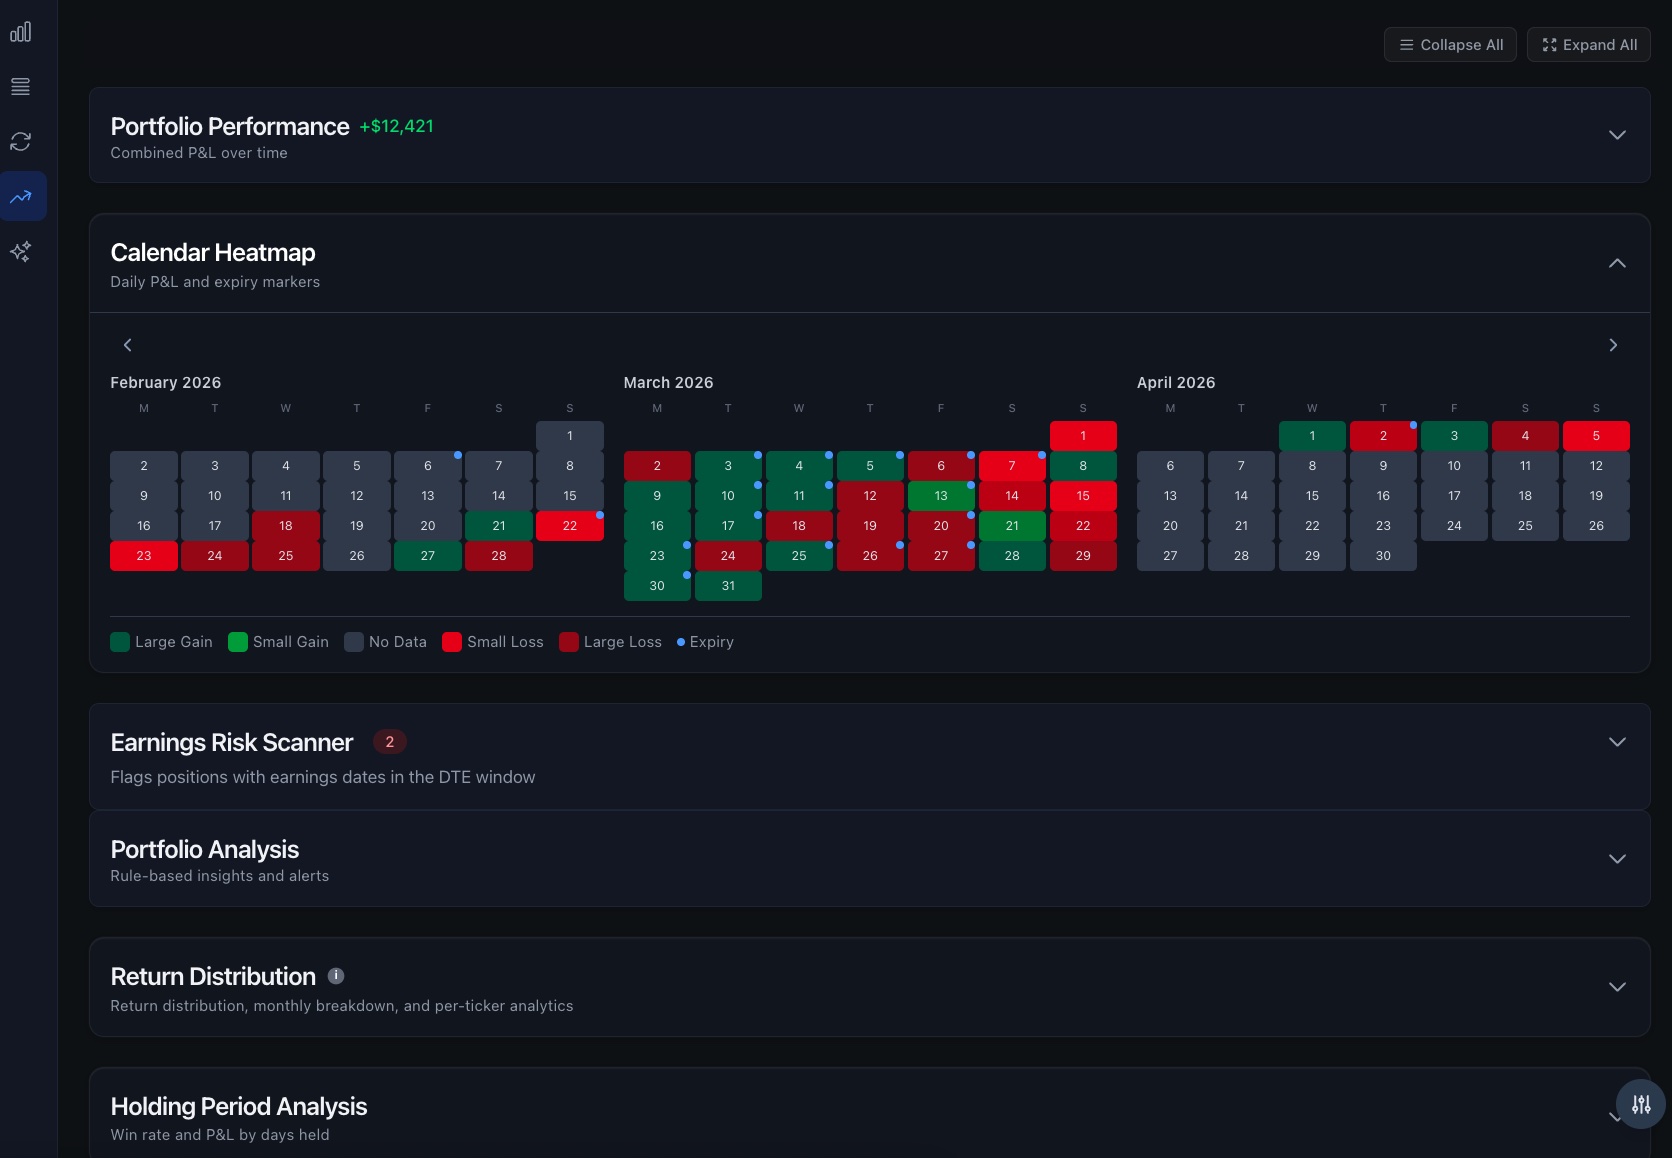
Portfolio Performance Chart
Equity curve, drawdown chart, P&L by ticker over any time range.
Dark / Light Mode
Full dark mode by default. Toggle any time.
Keyboard Shortcuts
Power-user nav: tab switching, quick add, refresh, close modals.
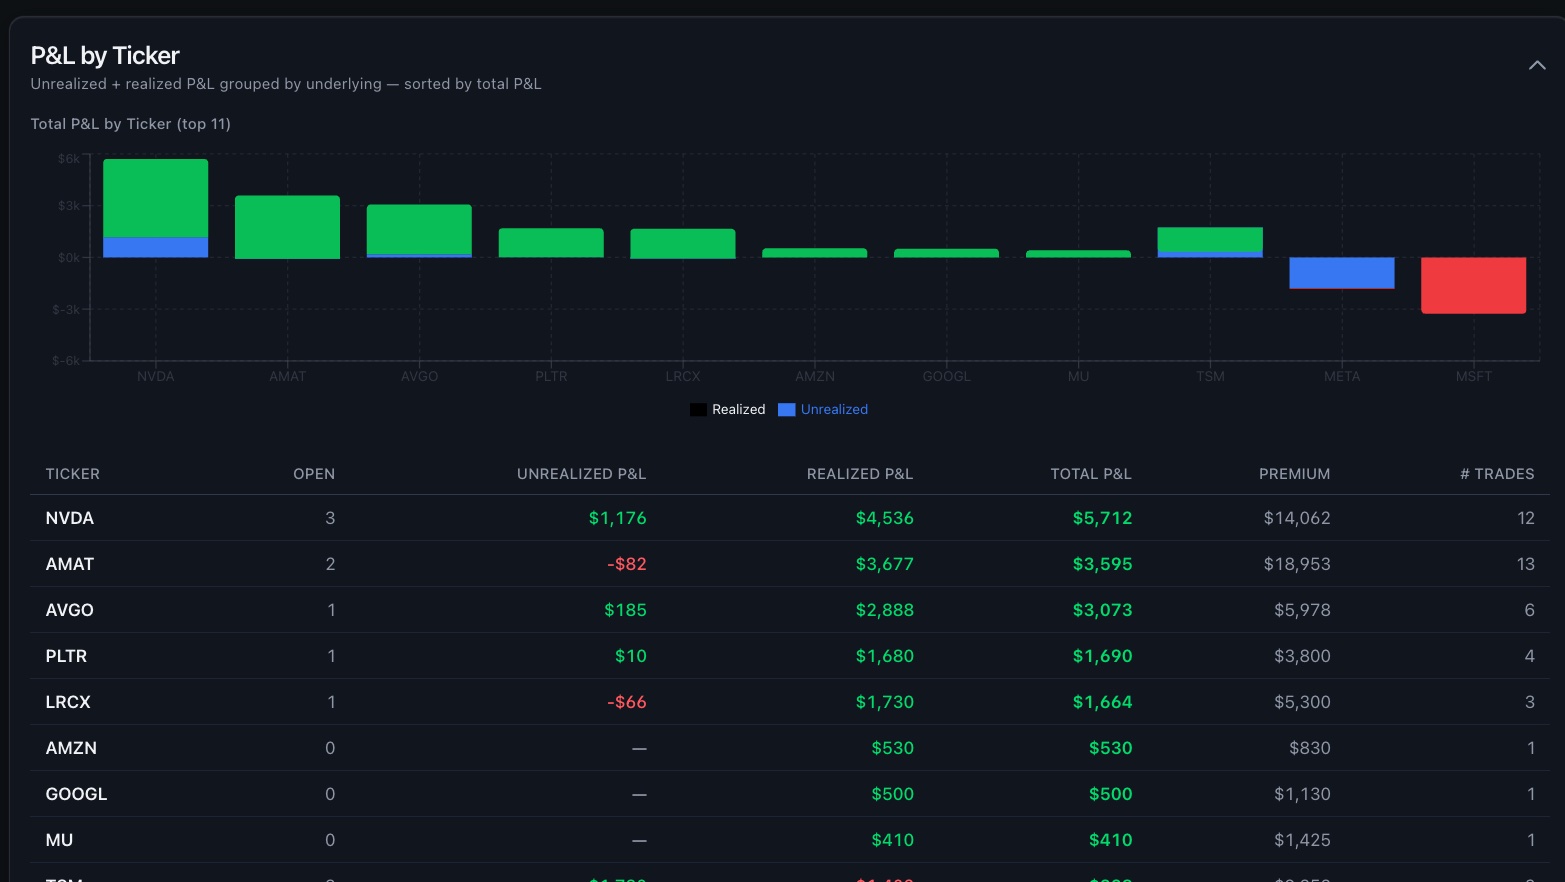
P&L by Ticker
Best and worst performers — realized + unrealized combined.
Trade Notes
Notes on any position. Carried forward on roll. Visible in detail panel.
Individual Position History
Click any row to expand a sparkline chart, full Greeks breakdown, and cash flow timeline for that position.
Cross-Position Comparison
Plot price history of multiple positions on one chart. See which tickers are moving together and which are diverging.
Compare price history across multiple positions — spot correlations and divergences at a glance
Free: track your wheel. Pro: never miss a roll, never lose a position.
No credit card to start. Pro unlocks multi-device sync, automatic backup, full trade history, and AI tools.
Free
- ✓Up to 10 active positions
- ✓Live Greeks + Close Indicator
- ✓Earnings calendar scanner
- ✓CSV import (Schwab)
- ✓Data stored on your device
Pro
- Everything in Free, plus:
- ✓Multi-device sync — phone + desktop
- ✓Auto cloud backup — survive browser clears
- ✓Unlimited positions + full trade history
- ✓All broker imports (Robinhood, Fidelity + more)
- ✓Wheel Cycle Tracking
- ✓AI Options Coach + portfolio analysis
- ✓Premium income dashboard
- ✓Priority support
Your wheel strategy deserves better than a spreadsheet.
Sign up in seconds. No credit card. No broker login. Import your first positions in 2 minutes.
Join wheel strategy traders who've replaced their spreadsheet with Options Tracker.